What Is a Trading Edge? The 385-Trade Math That Proves It
A trading edge is a measurable probability tilt, not a feeling: the expectancy math, why a 55% win rate needs about 385 trades to prove it, and how to test one.
Ask ten traders what their edge is and you’ll mostly hear adjectives: good instincts, discipline, experience reading charts. None of those are edges. A trading edge is a number, a measurable tilt in the odds that stays positive after costs across a sample large enough to rule out luck. If you can’t state yours as a number, you don’t know whether you have one.
This piece is the math for checking. It’s short, it’s not complicated, and it’s mildly uncomfortable: the single most common “edge,” a hot recent streak, is exactly the thing the math dismisses first.
What counts as a trading edge?
A trading edge is a repeatable condition under which your expected profit per trade is positive after costs: win rate times average win, minus loss rate times average loss, minus fees and slippage. The two words that matter are repeatable and measurable. A lucky quarter is neither.
Traders call this number expectancy:
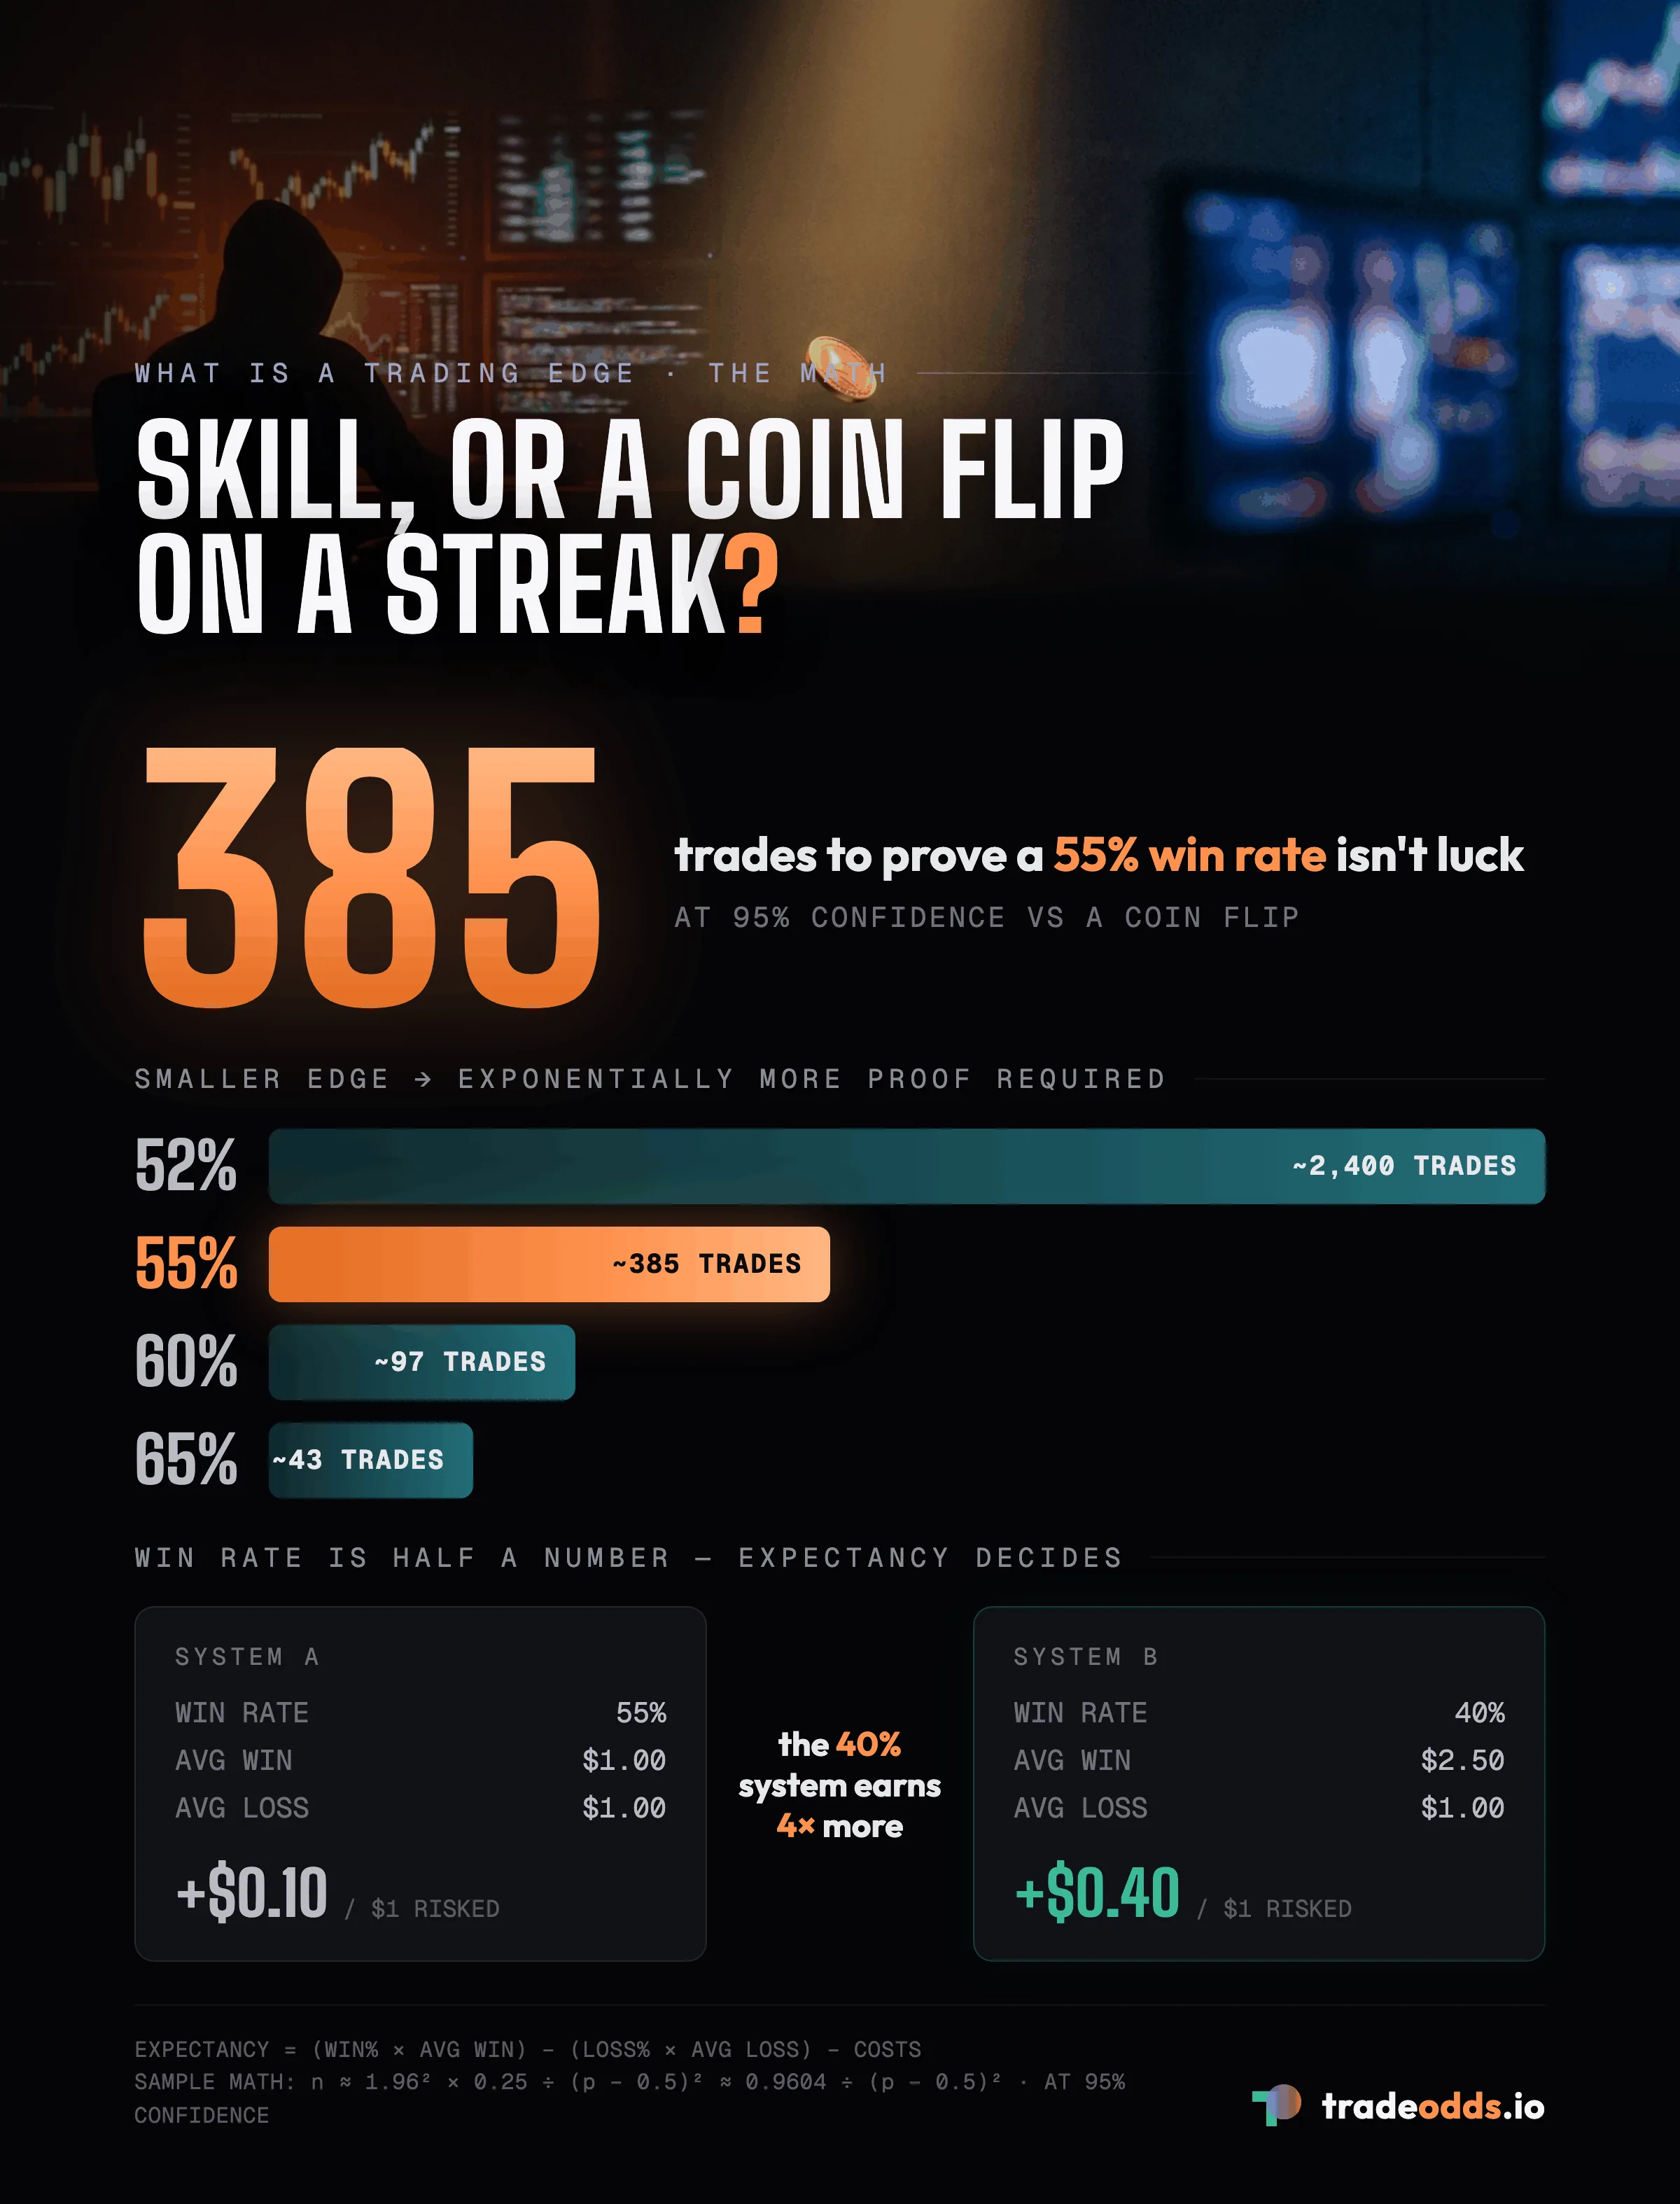
Expectancy = (Win rate × Average win) − (Loss rate × Average loss) − Costs
If expectancy is positive and holds up across hundreds of similar trades, you have an edge. If it’s positive across fourteen trades, you have a coin that’s come up heads a few extra times.
Is a high win rate the same as an edge?
No. A win rate without a payoff ratio is half a number, and the half you’re missing can flip the sign. These two systems show why:
| System | Win rate | Avg win | Avg loss | Expectancy per $1 risked |
|---|---|---|---|---|
| A | 55% | $1.00 | $1.00 | +$0.10 |
| B | 40% | $2.50 | $1.00 | +$0.40 |
System B loses more often than it wins and still makes four times more per trade, because its winners are two and a half times its losers. Meanwhile a 65% win rate with winners half the size of losers is a slow bleed: 0.65 × 0.5 − 0.35 × 1 = −$0.025 per trade, before costs make it worse.
So when someone quotes a win rate as proof of an edge, ask two questions. What’s the payoff ratio? And how many trades is that measured over? The second question is where most claimed edges die.
How many trades does it take to prove an edge? (The 385-trade rule)
At 95% confidence, a 55% win rate needs roughly 385 trades before it’s statistically distinguishable from a coin flip. Almost nobody runs this math on their own results, and it’s the least forgiving table in trading:
| Your true win rate | Trades needed to prove it |
|---|---|
| 52% | ~2,400 |
| 55% | ~385 |
| 60% | ~97 |
| 65% | ~43 |
(For the skeptics, the formula is n ≈ 1.96² × 0.25 ÷ (p − 0.5)², the standard sample-size calculation for a proportion.)
Read that table against your own trading. Sixty trades this year with 58% winners puts you, statistically, in coin territory. Not wrong, necessarily. Just unproven. Most retail “edges” live and die inside that unproven zone: twenty trades, a good stretch, confidence, size up, give it back.
The same table explains why “I’m up this month” means close to nothing. A 50/50 coin has a 50% chance of a winning month and roughly a 25% chance of two winning months in a row. Streaks are what randomness looks like.
Where do real trading edges come from?
Durable edges tend to come from one of four sources, and “reading charts better than everyone” is rarely on the list.
- Information. You know something the market hasn’t priced. Mostly the domain of institutions with better research or alternative data.
- Speed. You act on public information faster. An arms race you fund with infrastructure.
- Behavior. You systematically take the other side of predictable human mistakes: panic selling, chasing, calendar effects.
- Base rates. You know what actually happened the last several hundred times a condition occurred, while everyone else is going on vibes and a vivid memory of 1987.
The last two are the only ones realistically available to individual traders, and they’re related, because most behavioral edges only become visible when you count. Take October. Its reputation says crash month, since it owns 1929 and 1987. The count says it’s been the single best month to buy the S&P 500 over the past 30 years: +2.25% average forward return, positive 76.5% of the time. The gap between the reputation and the count is the edge, and it exists because almost nobody counts.
How do you check a setup without taking 385 live trades?
You can’t shortcut the sample size, but you don’t have to collect the sample live. History already contains it.
That’s the entire idea behind a base rate: define your condition precisely, find every past day it occurred, and measure what happened next. Thirty years of daily data holds hundreds of instances of most setups, a sample that would take a trading lifetime to accumulate with real money.
We run this constantly on our own product, so here’s a live example rather than a hypothetical. On July 14, 2026, we ran SPY’s conditions through TradeOdds, matching its daily move, momentum, market regime, and RSI profile against 30 years of history. The result: 43 historically similar days, and the market closed higher over the next 20 sessions after 76.7% of them, with a median gain of +2.10%. That’s not a prediction. It’s a measured base rate for the setup with the sample size attached, and 43 days is a sample the table above says to treat as suggestive rather than proven. The honesty cuts both ways; knowing your sample is thin is itself information most traders never have.
Two cautions before you backtest yourself into overconfidence. First, a condition you tuned until the numbers looked good is a fitted curve, not an edge. Test it on data it wasn’t tuned on; walk-forward validation is the standard defense. Second, edges drift. The seasonality numbers above looked different in the most recent decade than in the full record, so a base rate is worth rechecking on recent windows before you lean on it.
Do you actually have an edge? The four-question checklist
You have a trading edge if, and only if, you can answer all four:
- The condition. Can a stranger identify every occurrence of your setup without asking you?
- The expectancy. Do you know your win rate and payoff, net of costs, as numbers?
- The sample. How many occurrences, over what period, and does it clear the table above?
- The reason. What information, speed, or behavioral gap keeps paying you? An edge without a reason is usually noise that hasn’t reverted yet.
Anything you can’t answer is not a verdict; it’s a to-do list. Pick your most-traded setup, define it, and go count what it’s actually done. You can run that count against 30 years of history for any of about 3,200 stocks and ETFs — free to try, no account needed — and either your edge survives contact with the data or you just saved yourself its cost.
FAQ
What is a trading edge in simple terms?
A repeatable condition under which your average win times your win rate exceeds your average loss times your loss rate, after costs. In one line: positive expectancy that persists across a large sample. A good month is not an edge; a positive average across hundreds of similar trades is.
How many trades do you need to prove an edge?
Depends on the size of the edge. At 95% confidence, a 55% win rate needs roughly 385 trades to be distinguishable from a coin flip, a 52% win rate needs about 2,400, and a 60% win rate needs about 97. Small edges take enormous samples to verify live.
Is a high win rate the same as an edge?
No. A 55% win rate loses money if average losses are much larger than average wins, and a 40% win rate makes money if winners are 2.5x the size of losers. Expectancy, meaning win rate and payoff together after costs, is the number that decides.
How do you find out if a setup has an edge without trading it for years?
Test the setup against history. Define the condition precisely, find every past day it occurred, and measure what happened next. Thirty years of data can contain hundreds of matching instances, a sample that would take decades to collect live.
Try It Yourself
Run a free historical analysis on any stock, ETF, or crypto.
Start Free AnalysisNo account required. 10 free lifetime analyses.