The Stock Screener That Knows the Odds
Stop checking stocks one at a time. Ask the entire market one question — which symbols are setting up right now with the highest historical odds — and Factor Match scans 2,000+ stocks, ETFs, and crypto in one pass, each with its historical win rate.
What Makes Factor Match Different From a Stock Screener?
Traditional stock screeners filter by fundamentals (P/E ratio, market cap) or simple technical levels (above the 50-day MA). Factor Match filters by the same 17 quantitative market conditions TradeOdds uses for historical analysis — then attaches the historical outcome to every matching stock.
The result isn't a list of stocks that "look good." It's a list of stocks that share specific, named conditions today — with the historical base rate next to each one: how often stocks with these exact conditions closed higher, the median return, and the sample size.
What You See
Condition-Based Filtering
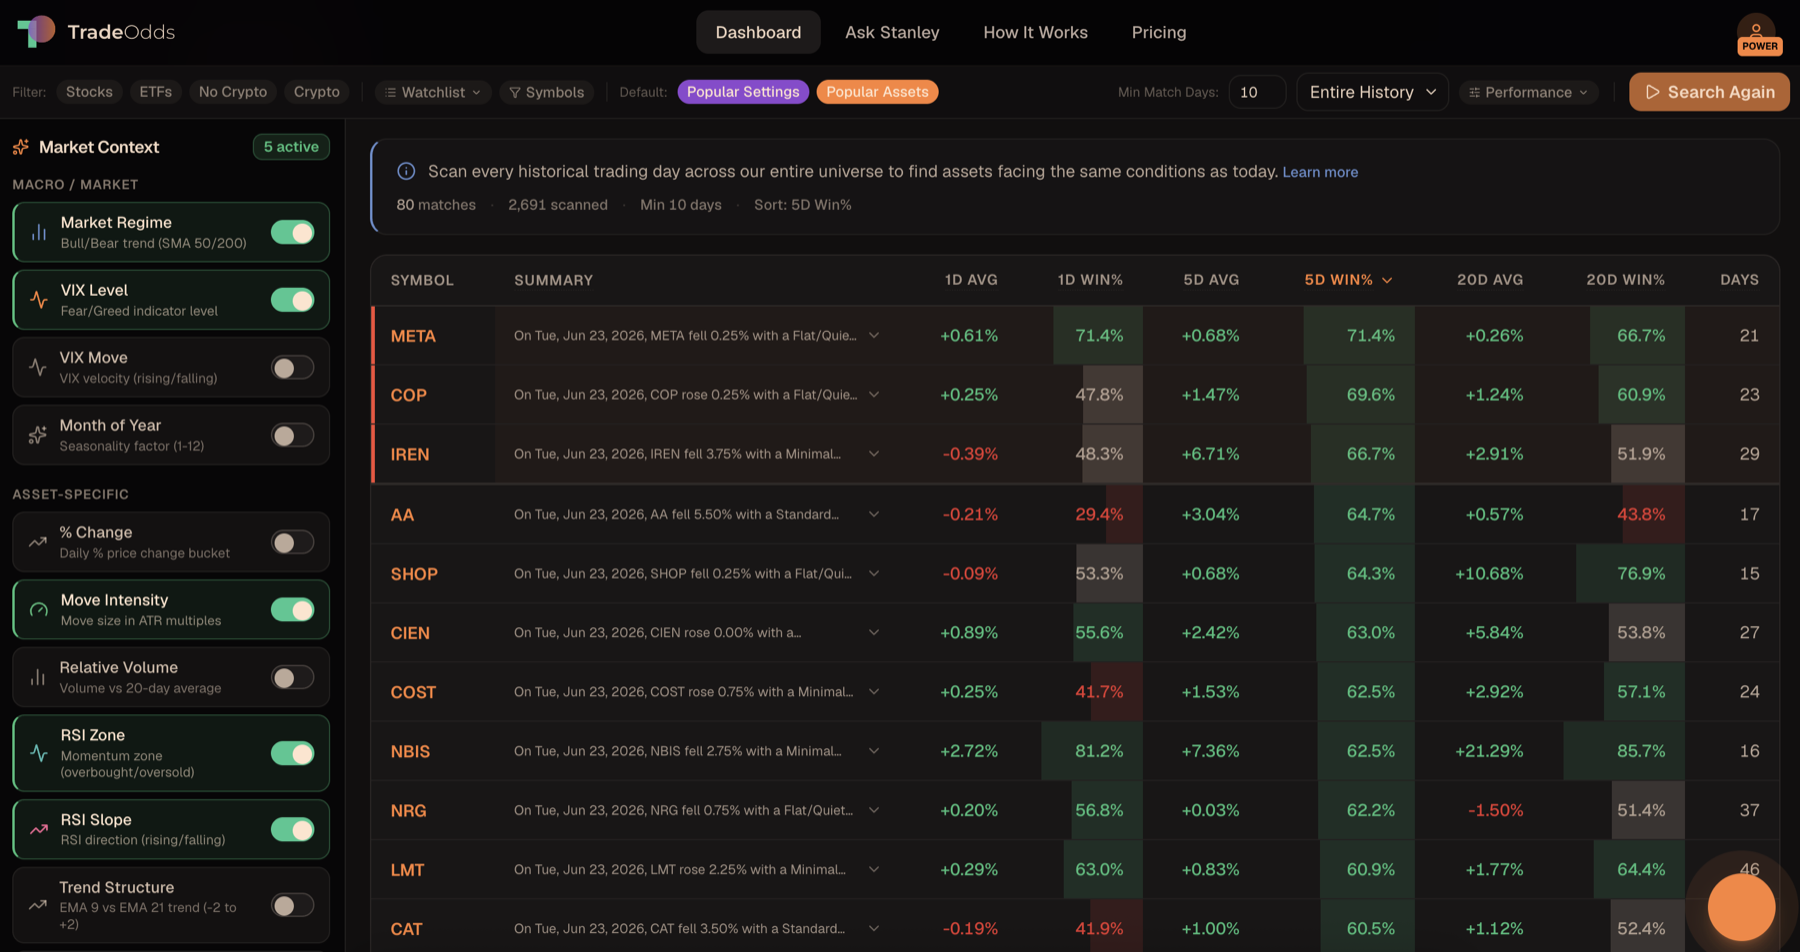
The "Market Context" panel lets you toggle any of the 17 conditions on or off — VIX elevated AND RSI oversold AND volume above average, or any other combination.
Historical Win Rates
Every matching stock shows its 1-day, 5-day, and 20-day historical win rate and average return. See which have the strongest base rates under today's conditions.
2,000+ Assets Scanned
Stocks, ETFs, and crypto — all scanned against your selected conditions in seconds, ranked by the win rate that matters to you.
Per-Symbol Summary
Each row carries the plain-English base-rate narrative for that symbol — the exact conditions matched and what happened next, historically.
This Is Factor Match
The Market Context panel on the left holds your condition toggles; the table ranks every matching asset with its 1-day, 5-day, and 20-day historical win rate and average return. Below is a live scan of today's market.
Scan today's market on the real tool. No signup for your first 5.