The Best Month to Buy Stocks: 30 Years of S&P 500 Data
We ranked all 12 months to buy the S&P 500 over 30 years of data. October leads, February trails, and the reason for both surprises most people.
Short answer: over the past three decades, the strongest month to have bought the S&P 500 was October, followed by March and November. The weakest was February, with September and midsummer close behind. The best six-month stretch was November through April. That surprises most people, because the two things everyone thinks they know about stock market seasonality turn out to be half wrong.
We ran this in TradeOdds against 30 years of daily S&P 500 history. For every trading day since the mid-1990s we measured the return over the next 20 trading days, roughly a month, using the next open to the closing price so it reflects what you could actually capture. Then we grouped those returns by calendar month. Here is what fell out.
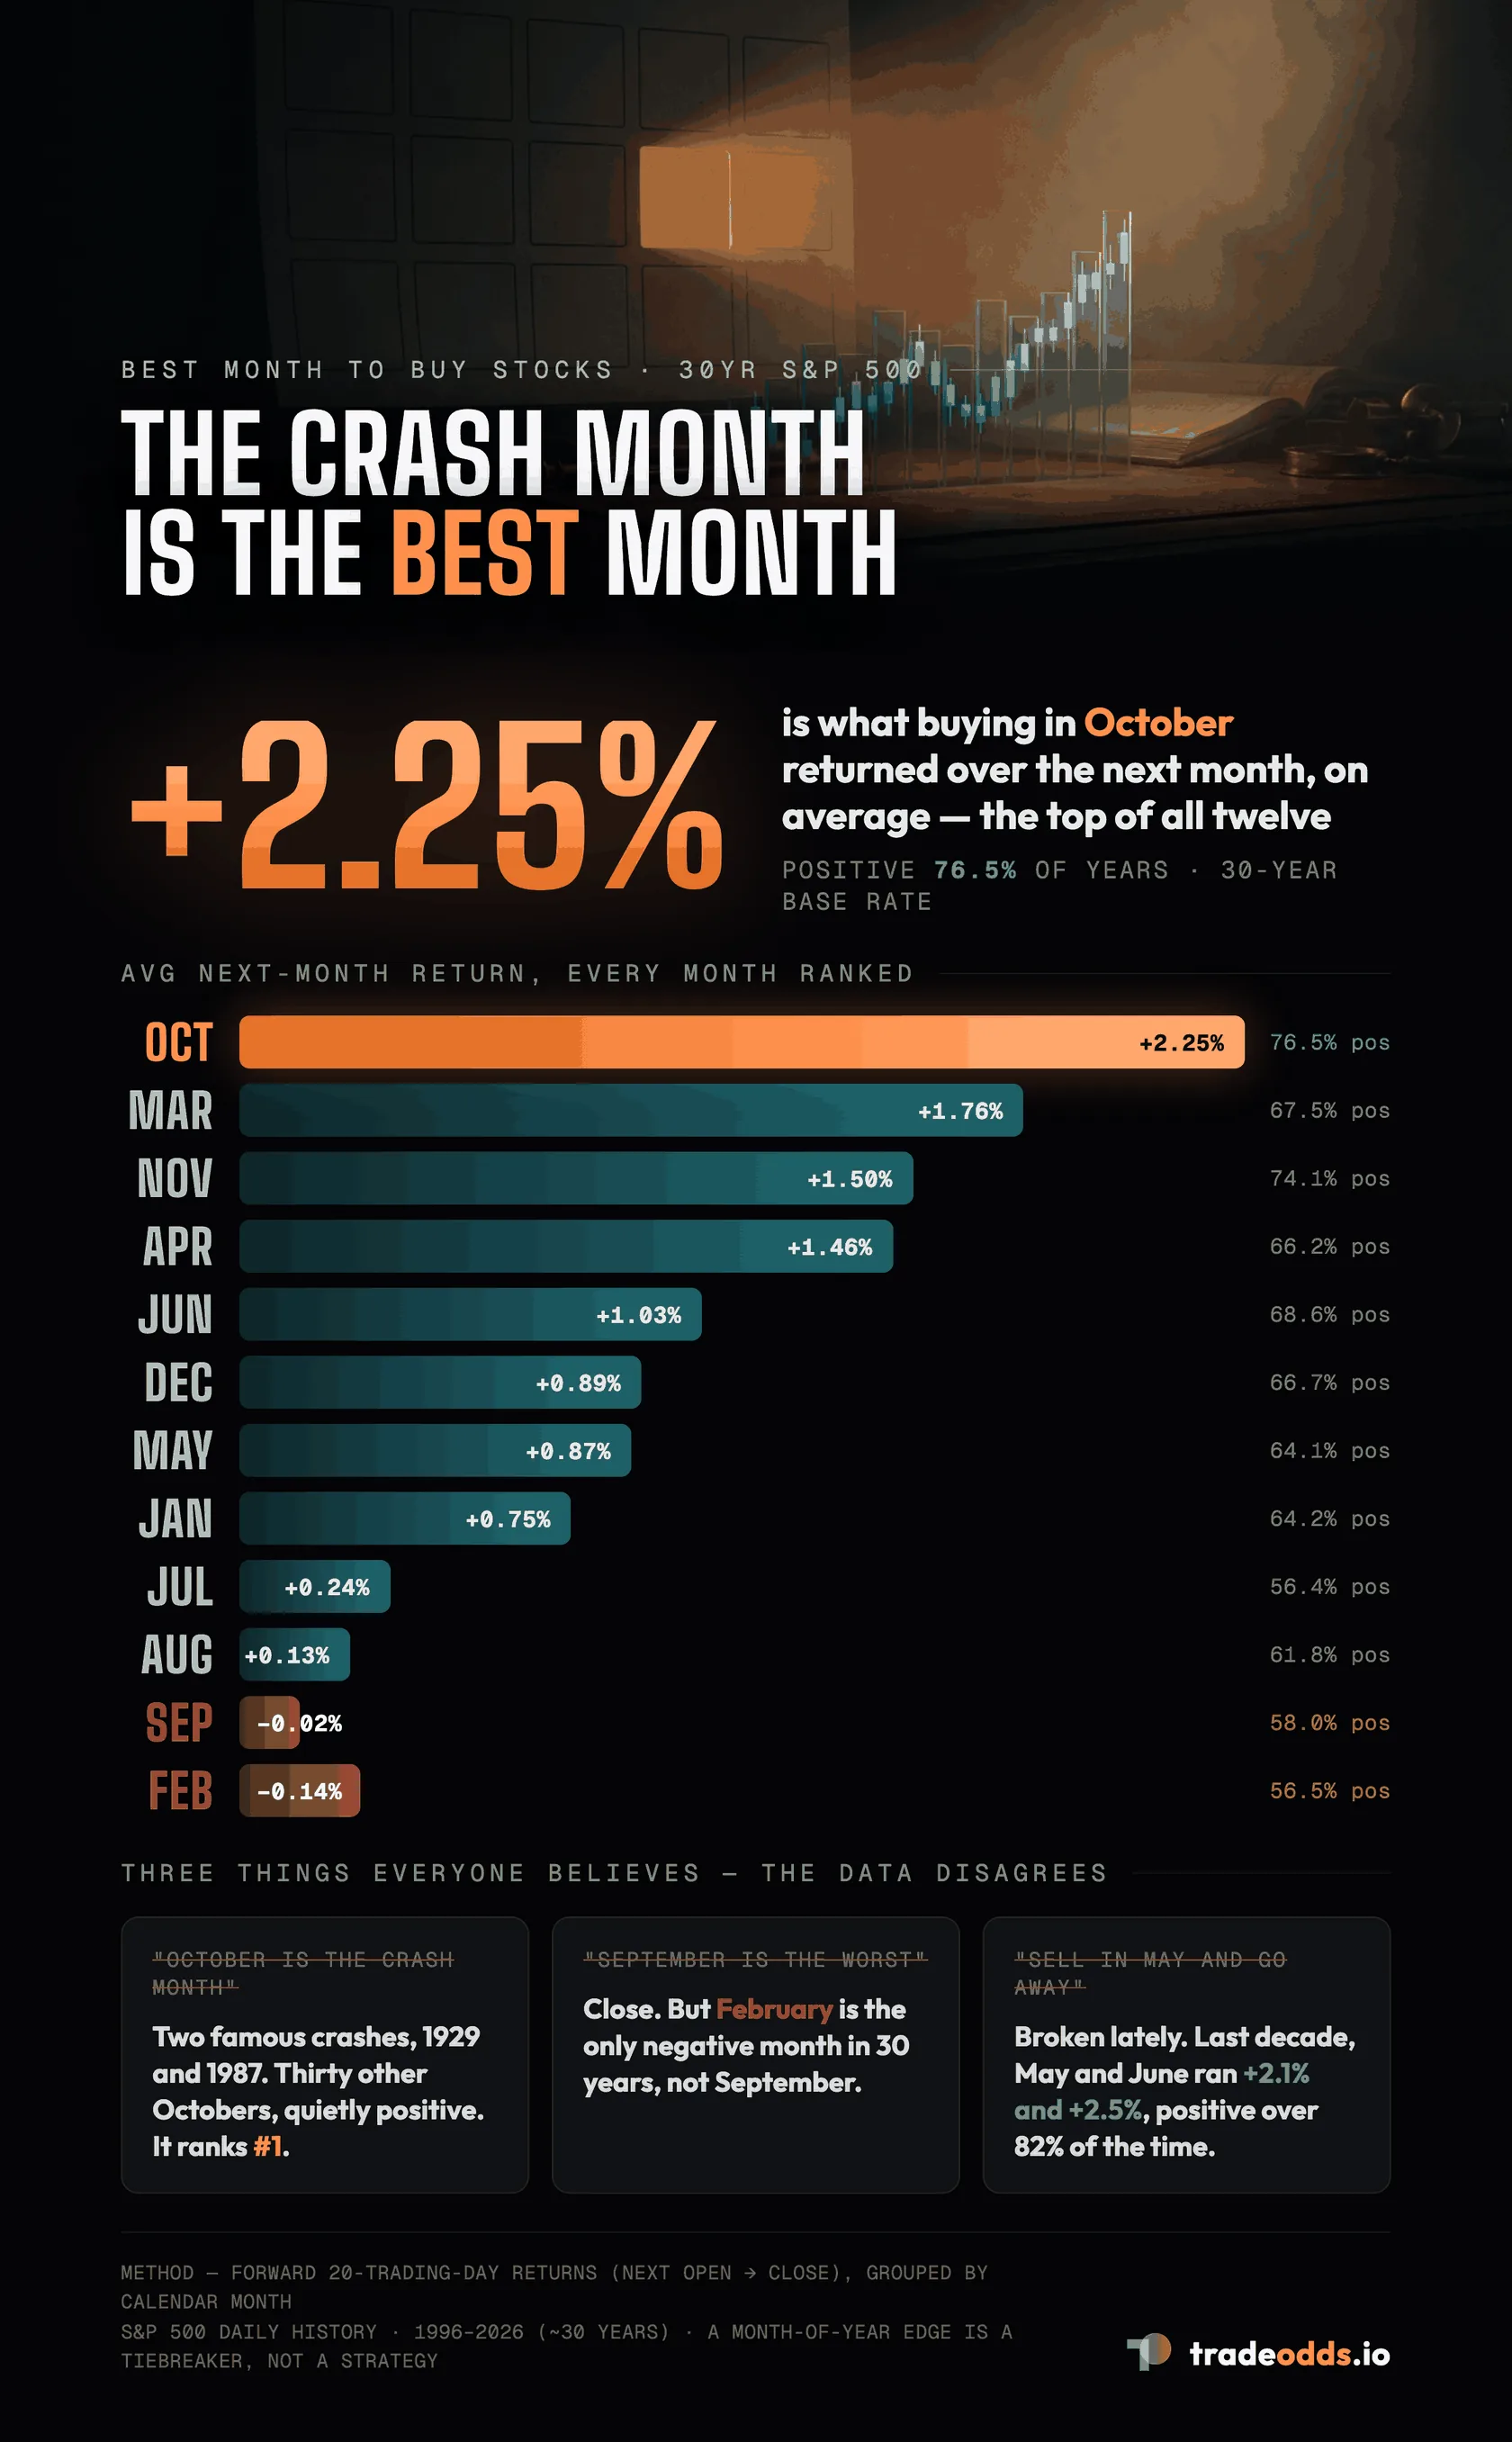
The best and worst months to buy stocks, ranked
| Month | Avg forward return (~1mo) | Win rate | Median |
|---|---|---|---|
| October | +2.25% | 76.5% | +2.25% |
| March | +1.76% | 67.5% | +1.92% |
| November | +1.50% | 74.1% | +1.84% |
| April | +1.46% | 66.2% | +1.38% |
| June | +1.02% | 68.7% | +1.46% |
| December | +0.89% | 66.7% | +1.42% |
| May | +0.87% | 64.1% | +1.50% |
| January | +0.75% | 64.2% | +1.43% |
| July | +0.24% | 56.4% | +0.56% |
| August | +0.13% | 61.8% | +1.15% |
| September | −0.02% | 58.0% | +0.87% |
| February | −0.14% | 56.5% | +0.96% |
Two numbers matter per month, not one. The average return tells you the typical size of the move. The win rate tells you how often it was positive at all. October wins on both, positive 76.5% of the time at more than two percent on average. February is the only month with a negative average, and it is barely better than a coin flip on direction.
One honest note on reading this table before you lean on it. These monthly windows overlap heavily, because every trading day gets its own forward-month return, so the roughly 650 readings per month behave more like 30 independent yearly draws than 650 independent ones. That means the gaps between neighboring months are noisier than the sample sizes suggest, and picking the single best and single worst of twelve will always exaggerate the extremes a little. Treat the ranking as directional, not precise to the decimal.
Isn’t October the crash month?
It owns the crashes and the best average return, and those are the same fact, not a contradiction.
October carries the two most famous single-day crashes in history, 1929 and 1987, so it feels dangerous. Over 30 years it has also been the single best month to have bought, higher three times out of four. The reason both are true is the mechanism most seasonality posts skip: October is where the year’s fear tends to peak and then reverse into the fourth-quarter rally. The high forward return is not evidence that October is calm. It is the payoff for buying into October weakness right before the seasonal strength arrives. The danger and the return are the same coin, which is exactly why a base rate matters here. The crash is real, and rare, and the reputation it earned does not match the average outcome that followed.
Isn’t September the worst month?
Close, but no. September is soft, yet February was the actual low point in the data.
This myth is nearer the truth than the last one. September does carry the weak-spot reputation, and its 58% win rate is genuinely poor. But its average return over the next month came out roughly flat, not deeply negative. February posted the only negative average in the set and the second-worst win rate.
So the folk wisdom points at the right season, early-to-mid year weakness, but the wrong month. If you were going to name one month to be cautious buying, the data says February, not September.
The named seasonal patterns, checked against the data
Most of what circulates about market seasons is a named pattern with a story attached. Here is what each one actually measures in the same 30 years of S&P 500 data.
Best six months (November to April). This is the real backbone of stock seasonality. The winter half averaged +1.06% per forward month against +0.76% for May to October. A genuine tilt, and the source of nearly every seasonal saying, including the next one.
Sell in May and go away. The old rule says the market sleeps from May through October. Half true: the summer half does average lower, but the single best month, October, sits at the tail of the supposed dead season, so the clean version breaks. It is a gentle lean, not a switch.
The Santa Claus rally. The seven-day window straddling year-end, the last five trading days of December plus the first two of January, averaged +0.86% and finished positive in 74% of the last 31 years. Small in size, high in reliability. One of the steadier seasonal tilts in the record, though a fraction of a percent is not a strategy on its own.
The January effect. Historically a small-cap story, cash flowing back into beaten-down small companies at the turn of the year. For the S&P 500 itself, January is middling, +0.75% on average, right in the pack. The effect is real in the corners of the market, not in the large-cap index most people actually hold.
The September effect. The one weak-season reputation the data half-supports. September’s average is roughly flat and its win rate is the second worst of any month, so it earns the “soft” label, just not the “worst” one. February takes that.
Has the pattern held, or is it drifting?
This is the question the generic seasonality posts never ask, and it is the one that matters most. A 30-year average can hide a pattern that quietly reversed. So we ran the same query on just the last ten years. Two things jumped out.
Sell in May has broken. Over the full record, summer was middling. In the last decade May and June were among the strongest months of all, up 2.2 and 2.3 percent on average with win rates above 82 percent. Whatever seasonal drag summer once carried is gone in the recent data.
February got worse, not better. Its recent average is negative 2.4 percent, positive only 44 percent of the time. The market’s real soft spot has sharpened rather than faded.
October held. Strong across the full record, strong across the last decade, right around a 79 percent win rate either way. Its reputation for danger stays wrong in every window we checked.
The lesson is not a fresh set of rules. It is that seasonality drifts, so a base rate is worth rechecking on recent data before you lean on it. The tidy averages that circulate in most articles are often decades stale.
How much should this actually change what you do?
Honestly, not much on its own. A month-of-year edge of one or two percent is a gentle tailwind, not a trading system. Buy good companies in February and plenty of them go up. Buy junk in October and plenty go down. The month is one weak factor among many stronger ones.
Where it earns its keep is as a tiebreaker and an expectation-setter. If you were already going to add to a position and the calendar says February, you might wait for a better setup. If it is October and the win rate is 76%, you can lean into a setup you already liked with a little less hesitation. It sharpens a decision you were already making. It does not make the decision for you, and it is not a reason to size up on the month alone.
Does this hold for individual stocks?
Sometimes, and often more sharply. The S&P 500 is an average of 500 names, so its seasonality is smoothed out. A single stock can carry a much stronger monthly pattern, usually tied to its own earnings calendar or a recurring demand cycle in its business. A retailer heading into the holidays and a chipmaker before a product season do not share the market’s seasonal shape.
That is the version worth checking before you lean on any of this: not “what does the market do in March,” but “what does this specific stock do, and how often.” The market-wide table above is the starting point, not the answer for any one name. It is the same idea as a trading edge: a small tilt only means something once you have measured it on the exact thing you are trading. If you want to find the names setting up that way right now, that is what a stock screener built on historical odds is for: pick the conditions, including the month, and it returns the tickers matching them today with their own win rates.
How we got these numbers, and how to check your own
Every figure here came from one query against 30 years of daily S&P 500 data: group each day by its calendar month, measure the return over the following 20 trading days, and report the average, the median, and how often it was positive. No model, no forecast, just the historical record counted honestly. That is all a base rate is, the frequency of what actually happened when conditions looked like they do now. If you want the weekly version of the same question, we ran it for the best day of the week to buy too.
You can run the same thing for any ticker. TradeOdds indexes 35 years of history across roughly 3,200 stocks, ETFs, and crypto, with month-of-year built in as one of its match conditions. Point the stock analysis tool at a specific name and month and it returns the base rate plus every matching day, so you are reading the source rows, not trusting a summary. Or run it the other direction: the stock screener takes the conditions and hands back the tickers setting up that way today, each with its own historical win rate. Both are free to try, no account needed, and Stanley, the built-in analyst, will run either one in plain English if you would rather just ask.
FAQ
What is the best month to buy stocks historically?
For the S&P 500 over the past 30 years, October, with an average forward return near +2.25% and a positive rate of 76.5%. March and November are close behind.
What is the worst month for the stock market?
February, the only month with a negative average forward return in 30 years of S&P 500 data, narrowly worse than September.
What are the best six months for stocks?
November through April. That window averaged +1.06% per month over 30 years versus +0.76% for May through October, the tilt behind the old “sell in May” saying, though the single best month, October, sits outside it.
Is the Santa Claus rally real?
In the S&P 500 data, yes, but small. The seven-day window around year-end averaged +0.86% and was positive 74% of years over 31 years. A reliable tilt, not a large move.
Is “sell in May and go away” real?
Partly. The November-to-April window does average higher than May-to-October, but the single best month, October, falls inside the weak season, so the rule is a rough tilt rather than a hard pattern.
Should I time my investing around the calendar?
No. A month-of-year edge of one to two percent is small and unreliable in any single year. Use it as a minor tiebreaker, not a strategy.
Try It Yourself
Run a free historical analysis on any stock, ETF, or crypto.
Start Free AnalysisNo account required. 10 free lifetime analyses.