Open-to-Close vs Close-to-Close Returns: Why the Difference Matters in Backtesting
Close-to-close returns (research) and next-open-to-close returns (executable) give different numbers for the same setup. Why the gap matters and which to use.
When you backtest a strategy, you have to decide what “the return after the signal” actually means. The two common choices — close-to-close and next-open-to-close — give different numbers for the same setup. The gap between them is the overnight gap, and it can be the difference between a backtest that works in research and a strategy that fails in production.
This is one of the most common methodology errors in retail backtesting.
The two measurements
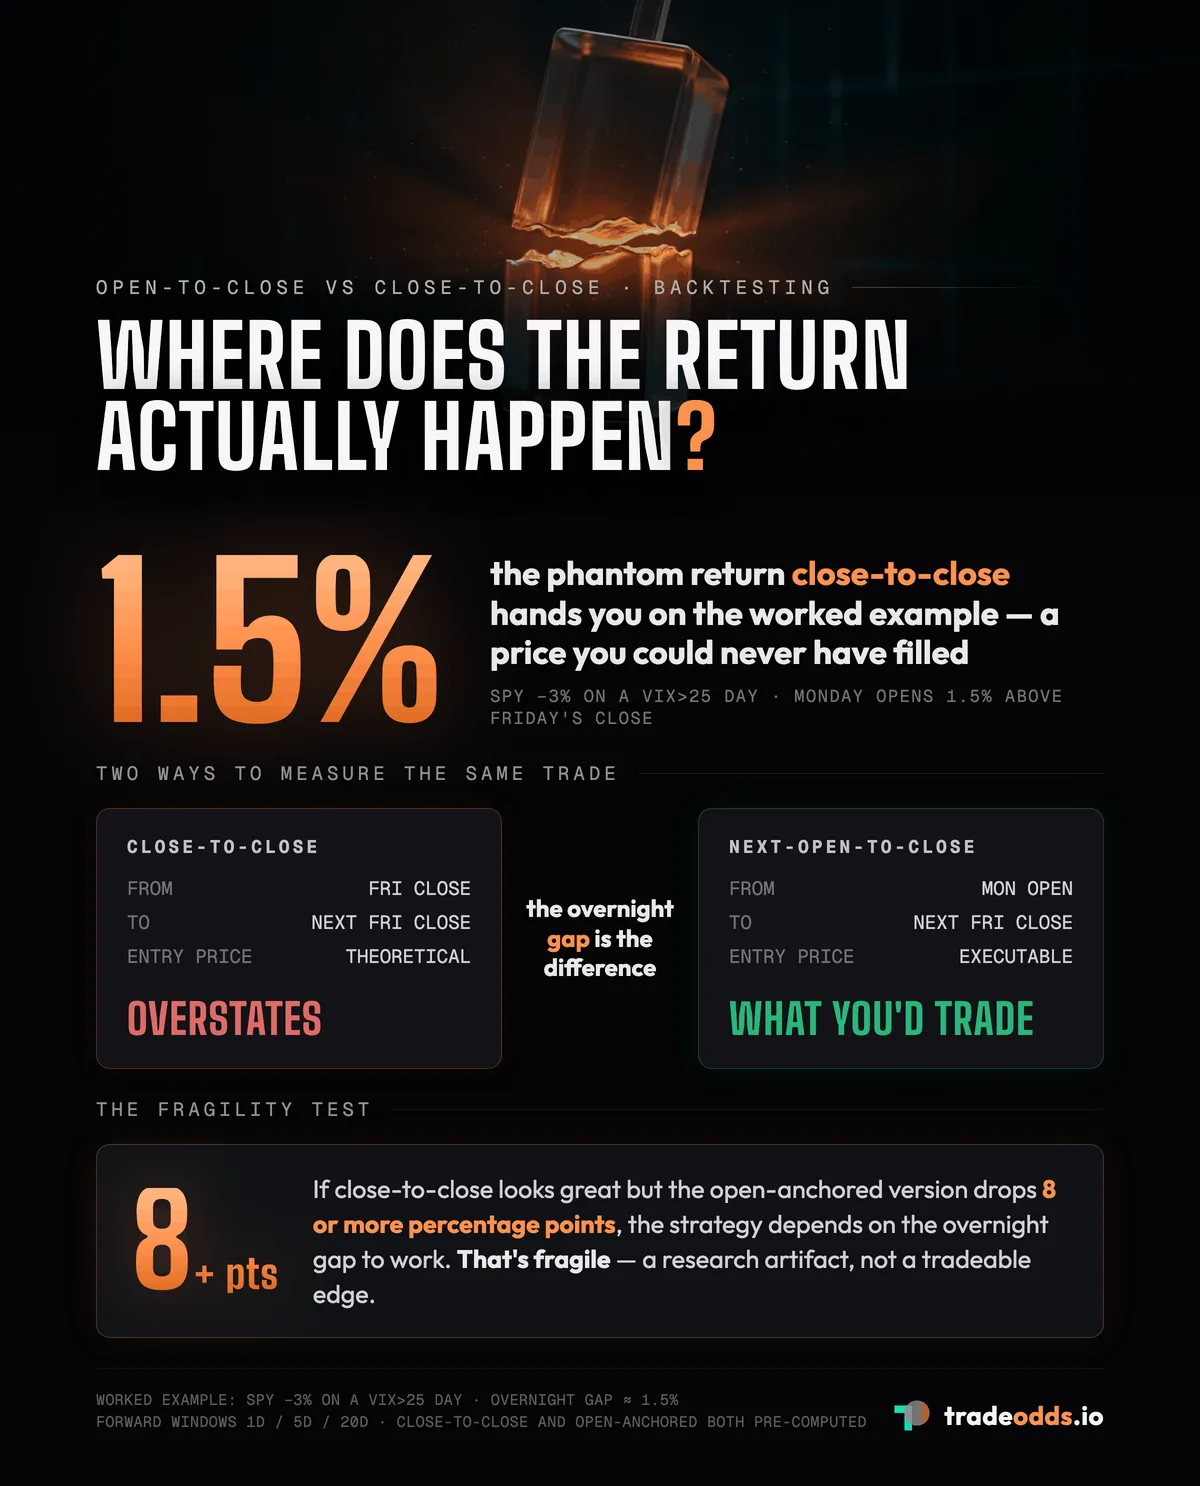
Close-to-close return. From the close of the signal day to the close of the forward window’s last day. For example, “5-day close-to-close return” goes from Friday’s close to next Friday’s close (or whatever the 5th trading day is).
Next-open-to-close return (open-anchored). From the OPEN of the trading day after the signal to the close of the forward window’s last day. Same 5-day example: Monday’s open to next Friday’s close.
The difference is the overnight gap between Friday’s close and Monday’s open. On most days this is small. On signal days — days with conditions worth trading — the overnight gap is often the largest single move in the entire window.
Why this matters
Consider a setup that fires after Friday’s close: “SPY just dropped 3%+ on a VIX > 25 day. Buy.”
Close-to-close measurement assumes you bought at Friday’s close — exactly at the closing print. The closing auction itself is deeply liquid, so that is not a fill problem: on a normal day you could get filled at the close with a market-on-close order. The problem is timing. Your signal is computed from Friday’s close, but MOC order entry closes before the closing print exists — around 3:50pm ET on the NYSE, roughly ten minutes before the bell. You can’t condition on a price that hasn’t printed yet and trade into that same print. By the time Friday’s close is known, the auction is already done, so your first executable price is Monday’s open.
Next-open-to-close measures from Monday’s open. This is the price you actually could have transacted at. It includes the overnight gap between Friday’s close and Monday’s open.
If Monday’s open is 1.5% higher than Friday’s close (a frequent, though not guaranteed, reaction to a sharp Friday selloff), your close-to-close backtest just gave you a return that was 1.5% better than you could have actually captured. Across hundreds of trades, that gap compounds into “this strategy looked great in research and lost money live.”
The structural bias
Close-to-close measurements systematically overstate returns for mean-reversion strategies on stress days. The reason: stress days that fire mean-reversion signals also tend to produce sharp recoveries during overnight and pre-open hours. By the time you can actually trade (next open), most of the bounce has already happened.
Close-to-close also overstates momentum strategies that fire at the close. Strong momentum days often gap further in the same direction overnight; the close-to-close measurement captures that gap, but a strategy that bought at the close couldn’t.
The bias goes the other way for strategies that fire at the open (rare in retail; more common in MOC/MOO algorithmic strategies for funds).
Which to use for what
| Goal | Use |
|---|---|
| Pure historical research — “what is the base rate of this pattern?” | Close-to-close (cleanest measurement of the pattern itself) |
| Strategy backtesting where you’ll actually trade | Next-open-to-close (matches your real execution) |
| Comparing your backtest to a published academic study | Match the study’s methodology (usually close-to-close) |
| Comparing two strategies fairly | Use the same measurement for both |
| Production live trading | Open-anchored forward returns |
How TradeOdds handles this
TradeOdds pre-computes both in the database. Each row of daily_metrics has:
fwd_1d_pct— close-to-close 1-day forward returnfwd_5d_pct— close-to-close 5-day forward returnfwd_20d_pct— close-to-close 20-day forward return- Plus their open-anchored equivalents (next-open-to-close at the same windows)
The columns are pre-aligned across the trading calendar — they correctly handle holidays, half-days, and weekend boundaries. You never write your own join against a calendar table; the numbers are already there.
When you run an Analyze query in the dashboard or via the API, the default forward return is open-anchored, so the numbers you see match what you could have actually traded. You can switch to close-to-close in the conditions panel if you’re doing academic-style research.
For Power User SQL queries:
-- "What's the base rate" (close-to-close)
SELECT AVG((fwd_5d_pct > 0)::int) AS win_rate
FROM daily_metrics WHERE symbol = 'SPY' AND ...

-- "What would I have actually captured" (open-anchored)
SELECT AVG((fwd_5d_pct_open > 0)::int) AS executable_win_rate
FROM daily_metrics WHERE symbol = 'SPY' AND ...
The gap between the two is your overnight-gap exposure for this setup.
When the gap is large, the strategy is fragile
A rule of thumb: if your close-to-close backtest looks great but the open-anchored version gives back more than about half of that edge, the strategy depends on the overnight gap to work. That’s fragile.
Real-world reasons the open-anchored version is often worse:
- The signal fires at the close → overnight news / earnings / Fed announcements move the open before you can trade.
- The overnight market (futures, ADRs) anticipates the move and the cash open already prices it in.
- Liquidity at the open is concentrated in the first 15 minutes — you may not get your fill at the “open” price quoted on the chart.
A strategy that holds up close-to-close AND open-to-close is structurally robust. A strategy that only works close-to-close is a research artifact.
Common questions
What about the bid-ask spread at the open? Open-anchored forward returns still use the official opening print. Real-world fills at the open often pay 1-3 bp of spread on liquid names, more on illiquid. Subtract this on top.
What about commissions? Neither close-to-close nor open-to-close includes commissions. Subtract them.
How does this interact with after-hours news? After-hours news (e.g. earnings) creates the overnight gap. Open-anchored returns capture the aftermath; close-to-close captures the news itself. Strategies that filter for “no earnings in next 5 days” often look similar in both measurements.
Should I use open-to-open instead? Open-to-open is the standard for systematic equity strategies that trade at the market open every day. It’s cleaner than open-to-close because there’s no overlap between the “entry” of one day and the “exit” of another. TradeOdds offers it as a non-default forward return; ask the schema docs at /docs/schema.
Summary
Close-to-close measurements answer “what happened historically.” Open-anchored measurements answer “what could you have traded historically.” For backtests you intend to deploy, the second is the one that matters.
Every backtest that looks great in research but loses money in production has at least one of these failure modes. Looking at both measurements upfront catches it before you commit capital.
Disclaimer. TradeOdds provides historical analysis for informational purposes only. This is not investment advice. Past performance does not guarantee future results.
Try It Yourself
Run a free historical analysis on any stock, ETF, or crypto.
Start Free AnalysisNo account required. 10 free lifetime analyses.