How to Find Historical Stock Pattern Matches (Without Drawing Lines on Charts)
Learn how TradeOdds finds historical stock pattern matches using 17 quantitative conditions instead of subjective chart patterns.
What Does “Pattern Matching” Actually Mean in Trading?
When most traders hear “pattern matching,” they think of chart patterns: head and shoulders, double bottoms, cup and handle formations. These visual patterns have been a staple of technical analysis for decades, and an entire industry of software tools exists to detect them automatically.
But there is a fundamental problem with chart-pattern matching: two analysts can look at the same price chart and disagree on whether a pattern exists. The subjectivity makes it difficult to measure, difficult to backtest, and difficult to trust.
There is another way to approach the question. Instead of asking “does this chart look like a pattern I recognize,” you can ask a more precise question: “what happened historically when a stock experienced this exact combination of measurable conditions?”
That is quantitative pattern matching. It replaces visual interpretation with numerical fingerprints.
How TradeOdds Approaches Pattern Matching
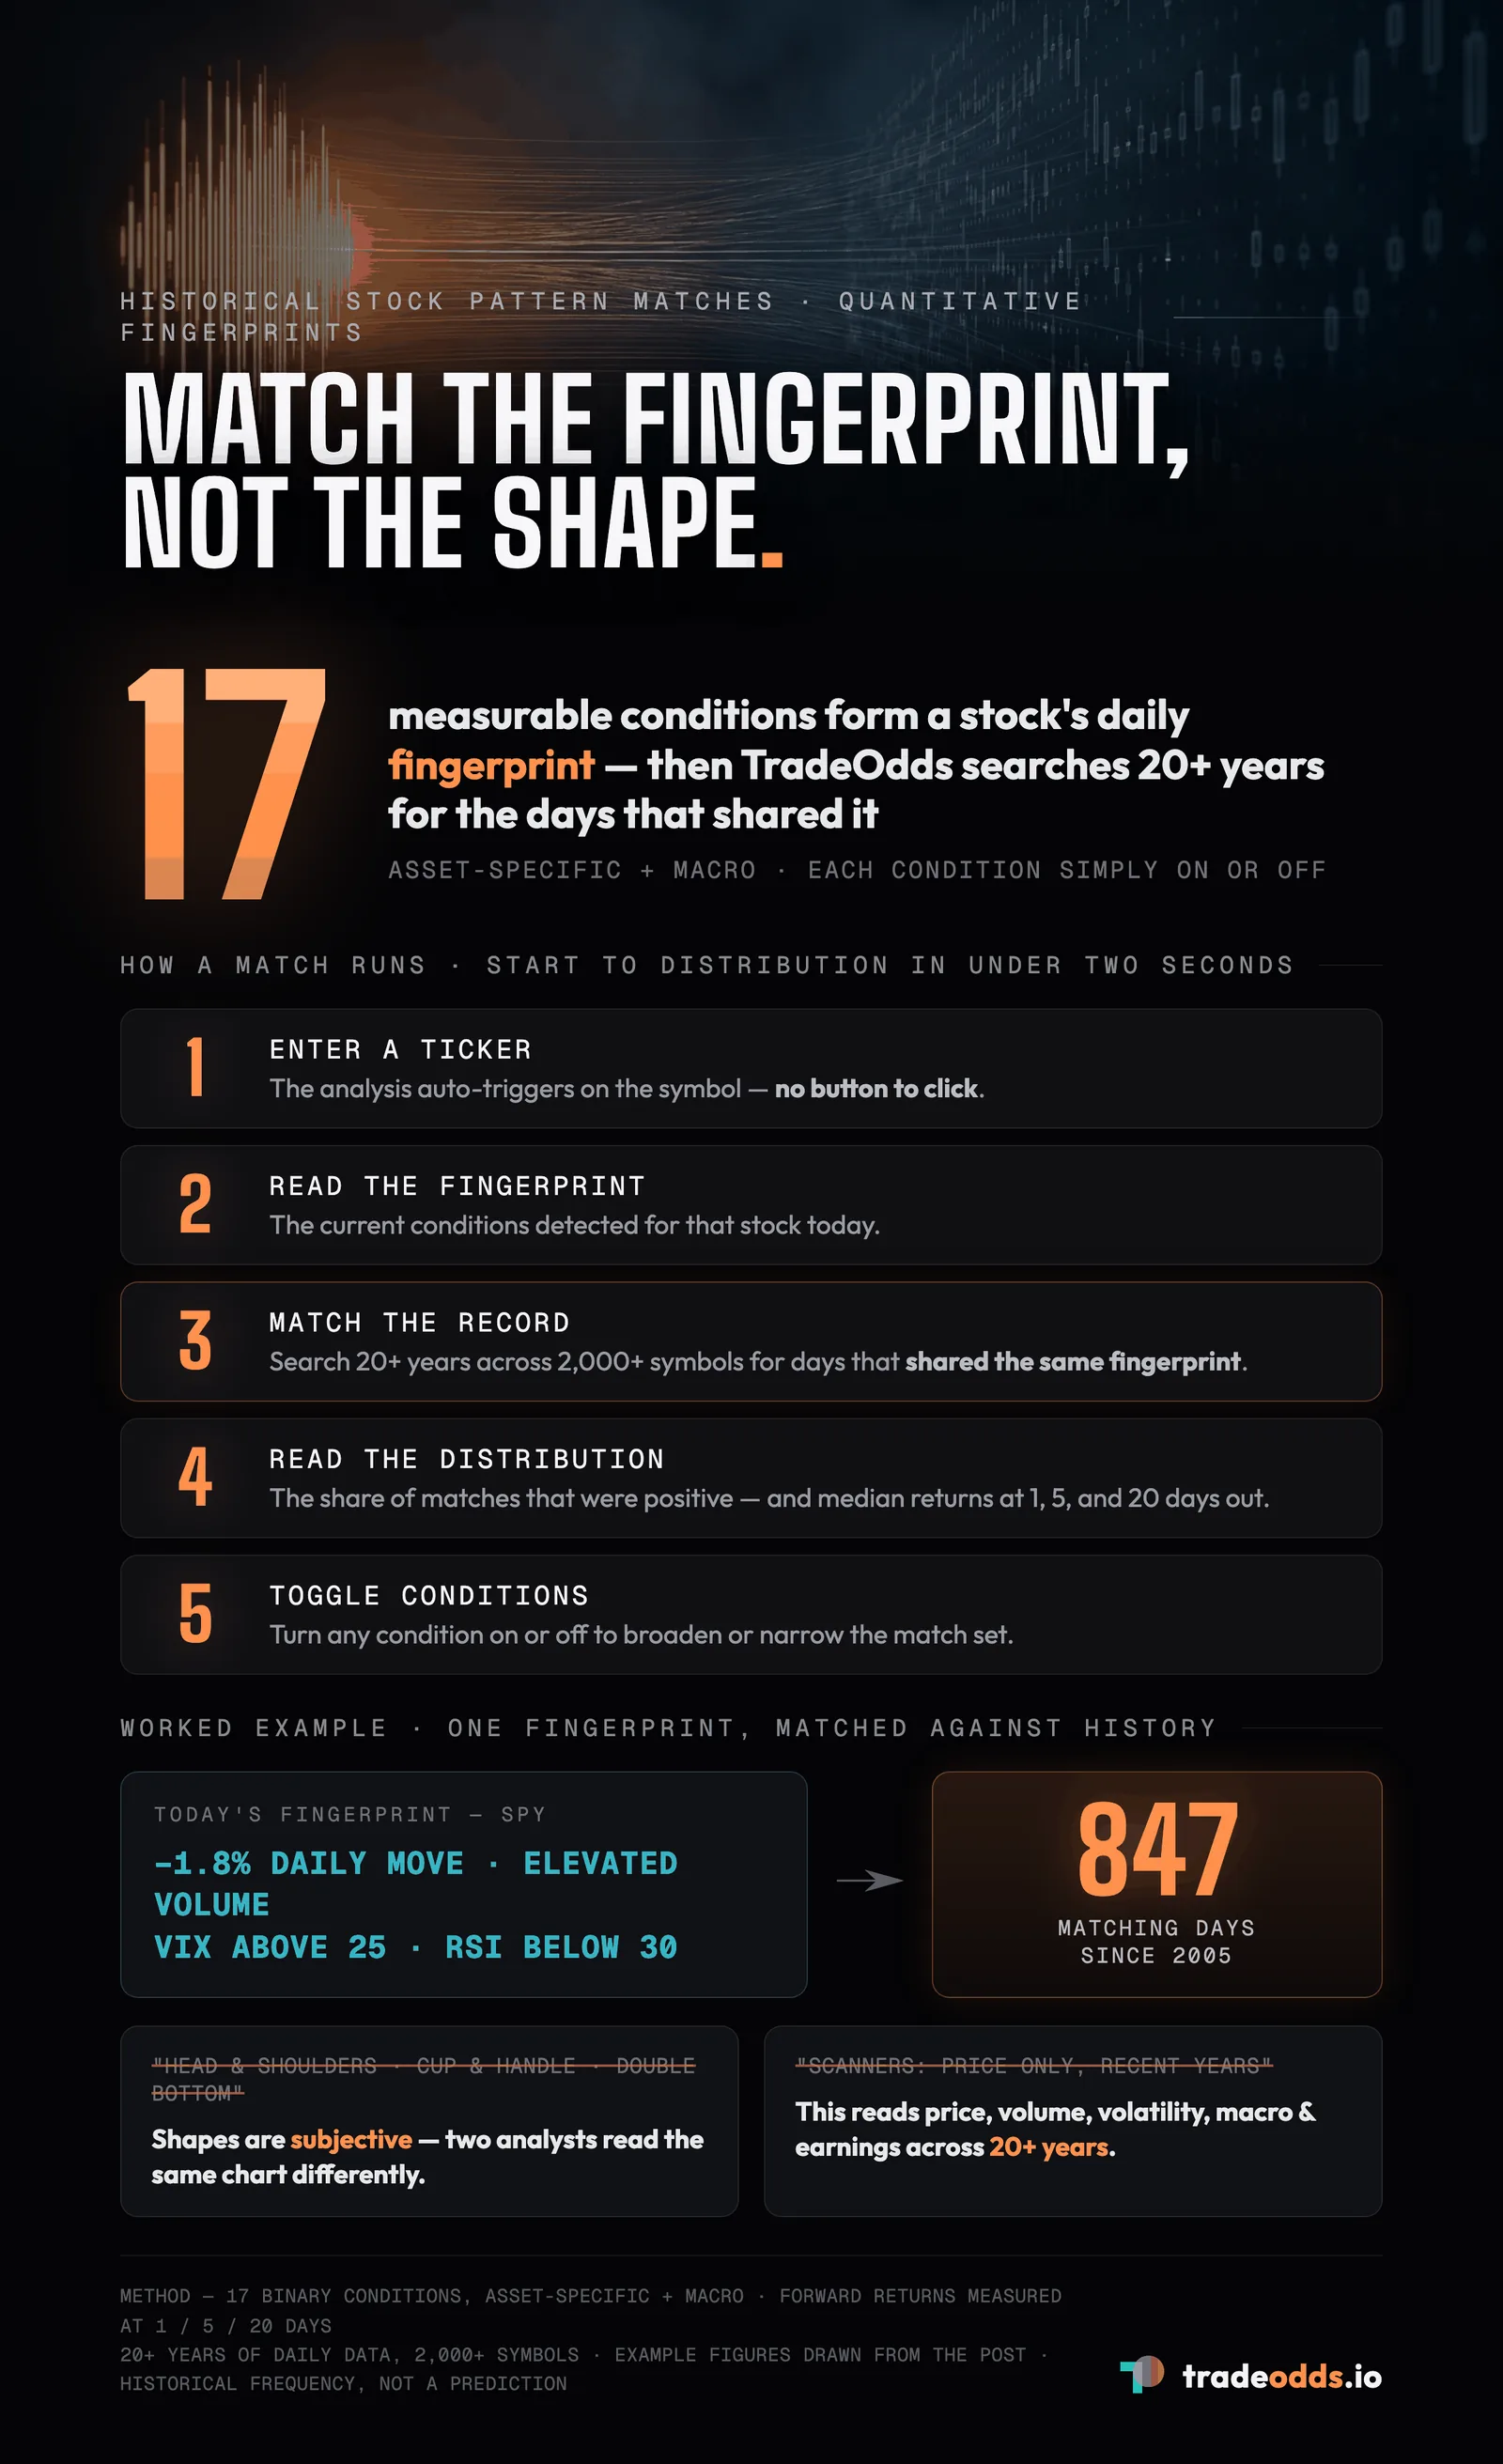
TradeOdds identifies historical pattern matches using 17 named market conditions. Each condition is a measurable, binary characteristic of a trading day. When you run an analysis, TradeOdds captures the current fingerprint of a stock, which is the specific combination of conditions present today, and searches the historical record for days that shared the same fingerprint.
The 17 Conditions
These conditions span three categories:
Asset-specific conditions describe what the individual stock is doing:
- Daily price move direction and magnitude
- Relative volume (today’s volume vs. the 20-day average)
- RSI level and RSI slope (momentum and momentum acceleration)
- Market structure (proximity to 52-week highs or lows)
- Earnings proximity and recent earnings performance
- Streak length (consecutive up or down days)
- Volume streak (consecutive days of above-average volume)
- Gap behavior (overnight price gaps)
- Recent analyst activity
Macro conditions describe the broader market environment:
- VIX level and VIX move direction
- Regime classification (bull, bear, or neutral based on moving averages)
- Macro risk bucket (a composite score of market-wide stress indicators)
- Calendar month (seasonality effects)
Each condition is either present or absent on any given day, creating a binary fingerprint. When TradeOdds finds historical days with the same fingerprint, it reports what happened next: the distribution of 1-day, 5-day, and 20-day forward returns across all matching days.
A Step-by-Step Walkthrough
Here is how a typical analysis works:
-
Enter a ticker symbol. TradeOdds auto-triggers the analysis when you select or change a symbol. No button to click.
-
Review the fingerprint. The dashboard displays the current conditions detected for that stock. For example: “SPY fell 1.8% on elevated volume with VIX above 25 and RSI below 30.”
-
See the match count. TradeOdds reports how many historical days shared this fingerprint. A result might read: “Across 847 matching days since 2005…”
-
Examine the outcome distribution. The results show the percentage of matching days that were positive at each forward period, the median return, and the full distribution of outcomes.
-
Adjust if needed. You can toggle individual conditions on or off to broaden or narrow the match set. Removing a condition increases the sample size but reduces the specificity of the comparison.
The entire process takes under two seconds.
What Makes This Different from Chart Pattern Scanners
Tools like TrendSpider and Tickeron offer automated chart pattern recognition. They scan for visual formations like triangles, wedges, and channels using image-recognition algorithms. These tools are useful, but they solve a different problem.
| Feature | Chart Pattern Scanners | TradeOdds |
|---|---|---|
| What it matches | Visual price formations | Quantitative condition fingerprints |
| Subjectivity | Moderate (algorithms disagree on pattern boundaries) | None (conditions are binary and measurable) |
| Conditions considered | Price action only | Price, volume, volatility, macro, earnings, structure |
| Historical depth | Varies (often limited to recent years) | 20+ years across 2,000+ symbols |
| Output | ”Pattern detected” with a directional bias | Full outcome distribution with sample size |
| Customization | Limited (pattern type selection) | Toggle any of 18 conditions per analysis |
The key distinction is that chart pattern scanners identify shapes. TradeOdds identifies situations. A shape tells you what the chart looks like. A situation tells you what measurable conditions exist right now, and what the historical record shows about similar situations.
When Quantitative Matching Is Most Useful
Quantitative pattern matching is most informative when the match count is large enough to draw meaningful conclusions. A result based on 12 matching days is less informative than one based on 400 matching days. TradeOdds displays the sample size prominently so you can judge the reliability of the comparison yourself.
The approach is also most useful when you already have a trade idea and want to pressure-test it against history. Rather than asking “what should I trade,” you are asking “what does the historical record show about the conditions surrounding this trade?”
This is the difference between a recommendation and a reference. TradeOdds provides the reference.
Frequently Asked Questions
How far back does the historical data go?
TradeOdds searches up to 20 years of daily data across 2,000+ actively traded symbols. The exact depth depends on the ticker; well-established large-cap stocks have the deepest history. Each analysis result includes the date range and match count so you can evaluate the sample size.
Are these the same as “chart patterns” like head and shoulders?
No. TradeOdds does not use visual chart pattern recognition. Instead, it matches on 17 quantitative conditions such as daily move magnitude, relative volume, VIX level, RSI, and earnings proximity. These are measurable numbers, not subjective shapes drawn on a chart.
Can I customize which conditions are included in the match?
Yes. Every analysis displays the detected conditions, and you can toggle each one on or off. Removing a condition broadens the match set (more historical days qualify), while adding conditions narrows it to more specific comparisons.
Is this a trading signal or recommendation?
No. TradeOdds shows what happened historically across matching days. It does not predict future outcomes, generate buy or sell signals, or make recommendations. The historical frequency data is a reference tool, not a trading system.
Try It Yourself
Run a free analysis on TradeOdds to see the quantitative fingerprint for any stock and what the historical record shows about similar conditions.
Try It Yourself
Run a free historical analysis on any stock, ETF, or crypto.
Start Free AnalysisNo account required. 10 free lifetime analyses.