How to Backtest a Single Trade Against History (No Code Required)
Most backtesting tools require coded strategies. TradeOdds lets you backtest a single trade against 20 years of history in seconds.
The Problem with Traditional Backtesting
Backtesting is one of the most important concepts in systematic trading. Before risking real money, you test your idea against historical data to see how it would have performed. The problem is that most backtesting tools are built for coded strategies, not individual trade ideas.
Tools like QuantConnect, Backtrader, and Zipline require you to define entry rules, exit rules, position sizing, and risk parameters in Python or another programming language. That is appropriate for systematic strategies that will run hundreds or thousands of trades. But it is wildly over-engineered for the most common question retail traders ask:
“I am looking at this stock right now. What does history say about this situation?”
You do not need a strategy engine to answer that question. You need a lookup tool.
What “Backtesting a Single Trade” Actually Means
When you backtest a single trade against history, you are asking: across all prior instances when this stock was in a similar situation, what happened next?
The “situation” is defined by measurable conditions: how much the stock moved today, what volume looks like relative to its average, where RSI sits, what the VIX is doing, whether earnings are approaching, and so on.
The “what happened next” is the distribution of forward returns: 1 day, 5 days, and 20 days out.
This is not a backtest in the traditional sense of simulating a strategy over time. It is a historical reference check for a single moment in the market. But for most retail traders evaluating a discretionary trade, this is exactly the information they need.
How TradeOdds Handles Single-Trade Backtesting
TradeOdds was built specifically for this use case. When you enter a ticker symbol, the platform automatically captures the current market fingerprint (up to 17 quantitative conditions) and searches the historical record for matching days.
The Backtest My Biggest Loser Tool
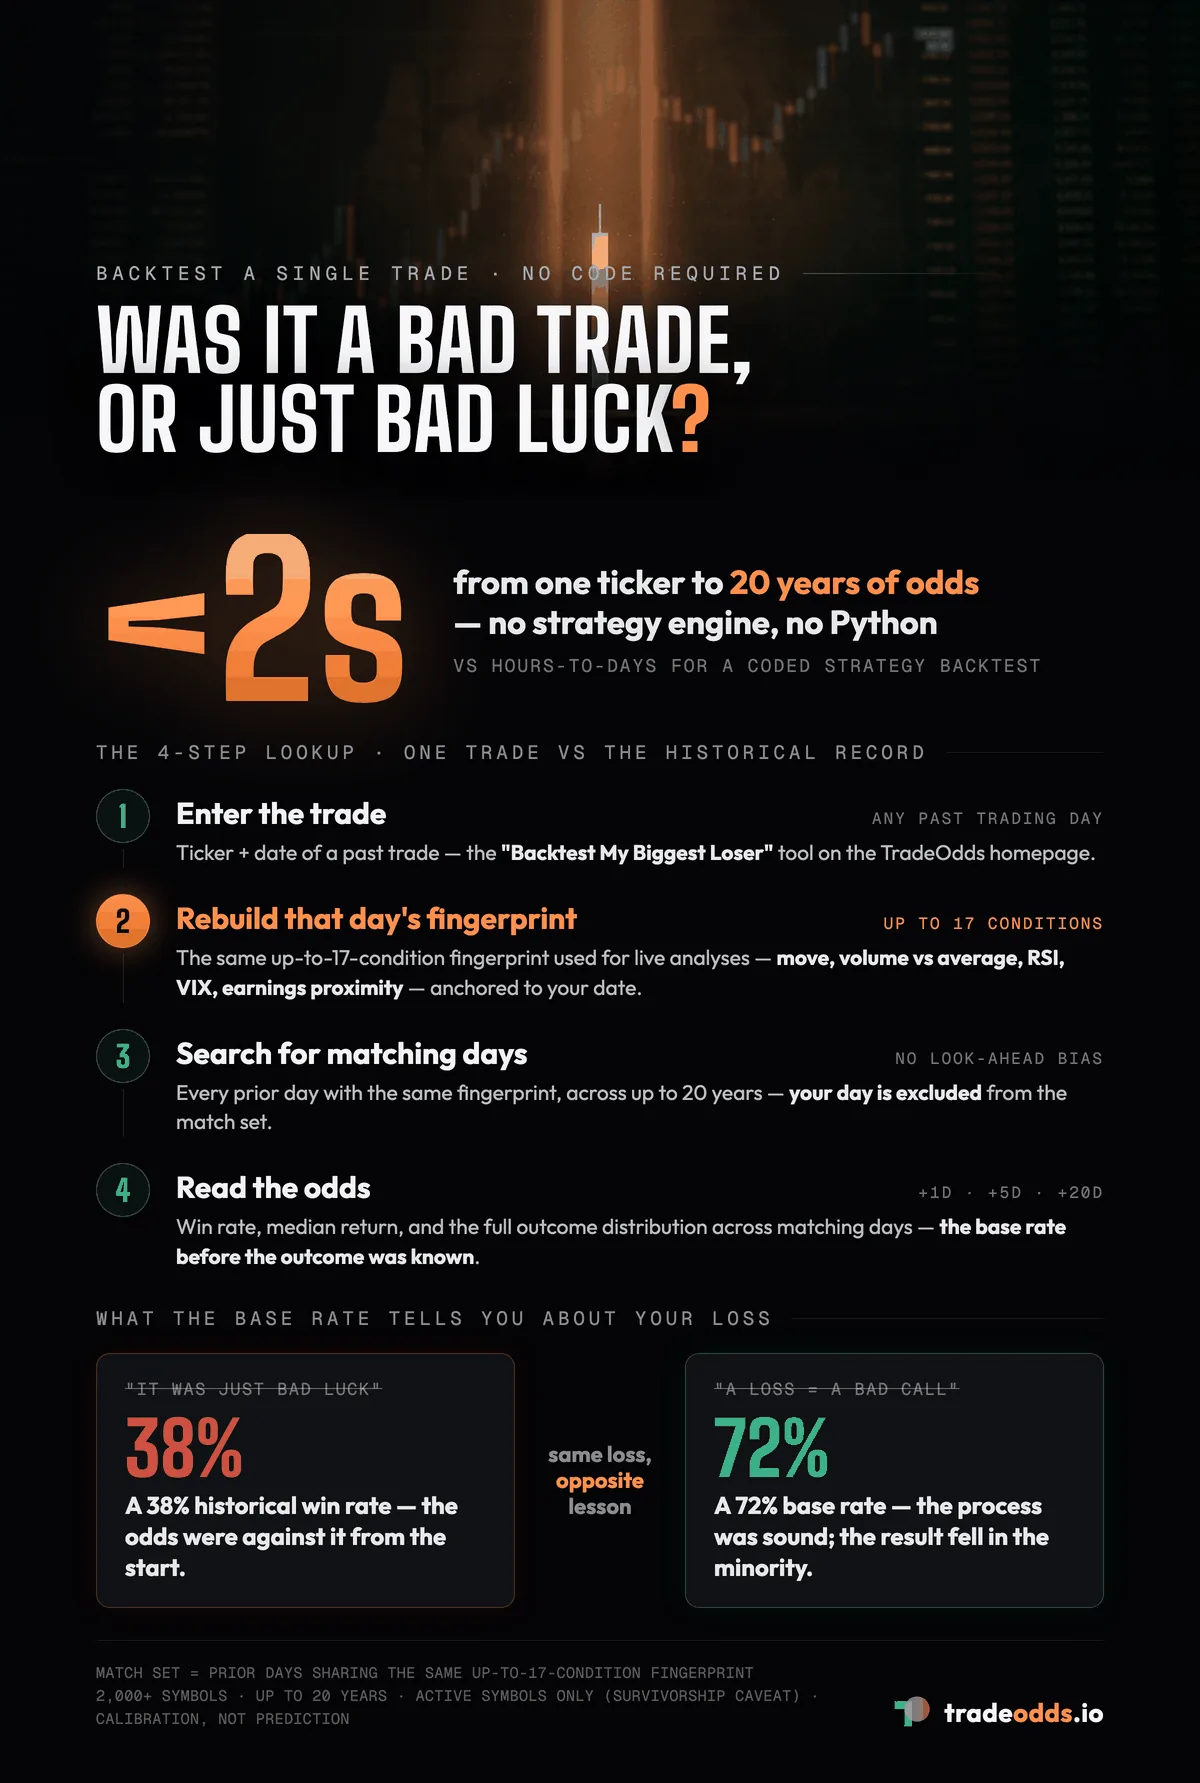
TradeOdds includes a feature called “Backtest My Biggest Loser” on the homepage. The premise is simple: take a trade that went badly, enter the symbol, and see what the historical base rate was for that situation.
Here is what it does:
-
You enter the ticker and date of a past trade. This can be any historical trading day.
-
TradeOdds reconstructs the conditions that were present on that day. It calculates the same 17-condition fingerprint that it uses for live analyses, but anchored to the historical date you specify.
-
It searches for other days with the same fingerprint. The match set excludes the day you entered (to avoid look-ahead bias in the comparison).
-
It shows what happened across matching days. You see the win rate, median return, and full distribution at 1-day, 5-day, and 20-day forward periods.
The insight this provides is often revealing. A trade that felt like bad luck may turn out to have had a 38% historical win rate in that situation, meaning the odds were against it from the start. Conversely, a losing trade might have had a 72% historical win rate, suggesting it was a reasonable decision that happened to fall in the minority of outcomes.
What You Learn from It
The value of backtesting a single trade is not about predicting the future. It is about calibrating your decision-making process.
If the base rate was low: The historical record suggests that the conditions surrounding your trade were unfavorable more often than not. This does not mean the trade was indefensible, but it means the odds required a strong thesis to overcome.
If the base rate was high: The conditions were historically favorable, and the loss fell in the minority of outcomes. This is useful information: it means your process may have been sound even though the result was not.
If the sample size was tiny: The combination of conditions was rare enough that there is not much historical precedent. This is also valuable to know, as it suggests you were operating in unusual territory.
Over time, reviewing your trades through this lens builds better intuition about which situations have historically favorable odds and which do not.
Backtesting a Single Trade vs. Strategy Backtesting
| Aspect | Single-Trade Backtest | Strategy Backtest |
|---|---|---|
| Input | One ticker, one date or current conditions | Coded rules (entry, exit, sizing) |
| Output | Historical outcome distribution for that situation | P&L curve, Sharpe ratio, drawdown |
| Technical skill required | None | Python, R, or platform-specific language |
| Time to result | Under 2 seconds | Hours to days (data prep, coding, debugging) |
| Best for | Discretionary traders evaluating individual ideas | Systematic traders validating a full strategy |
Both approaches have value. They answer different questions. Strategy backtesting asks “does this system work over many trades?” Single-trade backtesting asks “what do the odds look like for this specific situation?”
Frequently Asked Questions
Can I backtest any stock on any historical date?
You can backtest any of the 2,000+ symbols covered by TradeOdds. The historical depth extends up to 20 years, depending on when the stock began trading and when it met the platform’s minimum price and liquidity thresholds.
Does this account for survivorship bias?
TradeOdds analyzes stocks that are currently active and have sufficient trading history. Stocks that delisted or were acquired are not included in the match set, which is a form of survivorship bias present in most historical analysis tools. The match counts and distributions should be interpreted with this in mind.
How is this different from just looking at a chart?
Looking at a chart shows you what happened to one stock after one instance of a pattern. TradeOdds aggregates outcomes across every historical instance of the same measurable conditions, across the same stock and across 2,000+ other symbols if you use Factor Match. It is the difference between an anecdote and a dataset.
Can I use this for options trading?
TradeOdds reports forward return distributions, which are directly relevant to options traders evaluating directional exposure. If the 5-day historical win rate for a situation is 65% with a median move of +2.3%, that informs how you might think about strike selection and expiration. The platform does not model options-specific factors like implied volatility or Greeks.
Try It Yourself
Test one of your past trades against history with the Backtest My Biggest Loser tool on the TradeOdds homepage. See what the odds were before the outcome was known.
Try It Yourself
Run a free historical analysis on any stock, ETF, or crypto.
Start Free AnalysisNo account required. 10 free lifetime analyses.